Future ideas

From Logs to Insights: Leveraging Load Balancer Data for Smarter Monitoring
In a complex infrastructure, where load balancers are key to ensuring smooth traffic flow, gaining actionable insights from traffic patterns is critical. The challenge? Turning raw log data into meaningful information. Recently, we embarked on a project to extract valuable data from our load balancer logs, integrate it into our monitoring system, and prepare for…

Proactive Monitoring: Building a Smarter IT Infrastructure
Managing an IT environment goes beyond simply keeping the lights on. As infrastructures grow, so do the complexities of managing them. Reacting to issues after they occur is no longer enough. That’s why we built a proactive monitoring system—one that doesn’t just detect problems but helps predict and prevent them. The Monitoring Challenge With dozens…

From Logs to Intelligence: A Day in the Life of Building a Smarter Monitoring System
What started as a normal workday quickly turned into an epic adventure filled with logs, tables, APIs, and the occasional “database locked” error. Today, I teamed up with my trusted assistant (yes, that’s you, Binky!) to build a smarter, leaner monitoring infrastructure. Along the way, we faced mysterious InfluxDB issues, tangled SQL logic, and the…

Scaling Our Monitoring System with Dynamic Agents
In our previous blog, we explored how we integrated data collection and predictive modeling into our API. Since then, we’ve taken our monitoring system to the next level with a dynamic agent-based approach. Here’s what we’ve accomplished: The Problem We Solved As we scaled up, we realized that each server’s monitoring requirements could differ. Some…

From Data to Predictions – Building a Smarter Monitoring System
In the ever-evolving tech landscape, predictive monitoring isn’t just a luxury – it’s a necessity. What if your servers could tell you when they need updates, resources, or attention? With data collected via our API and some machine learning magic, we’re taking the first steps into smarter, data-driven monitoring. In this blog, we’ll explore how…

Building a Secure, Configurable, and Scalable Monitoring API
In a world where infrastructure monitoring is vital, having a flexible and secure way to collect and process custom data is essential. In this blog post, we’ll take you through building an API that not only allows for dynamic field configurations but also includes robust security with API keys tied to specific servers. We’ll walk…

Deploying Flask Applications with Gunicorn as a WSGI Server
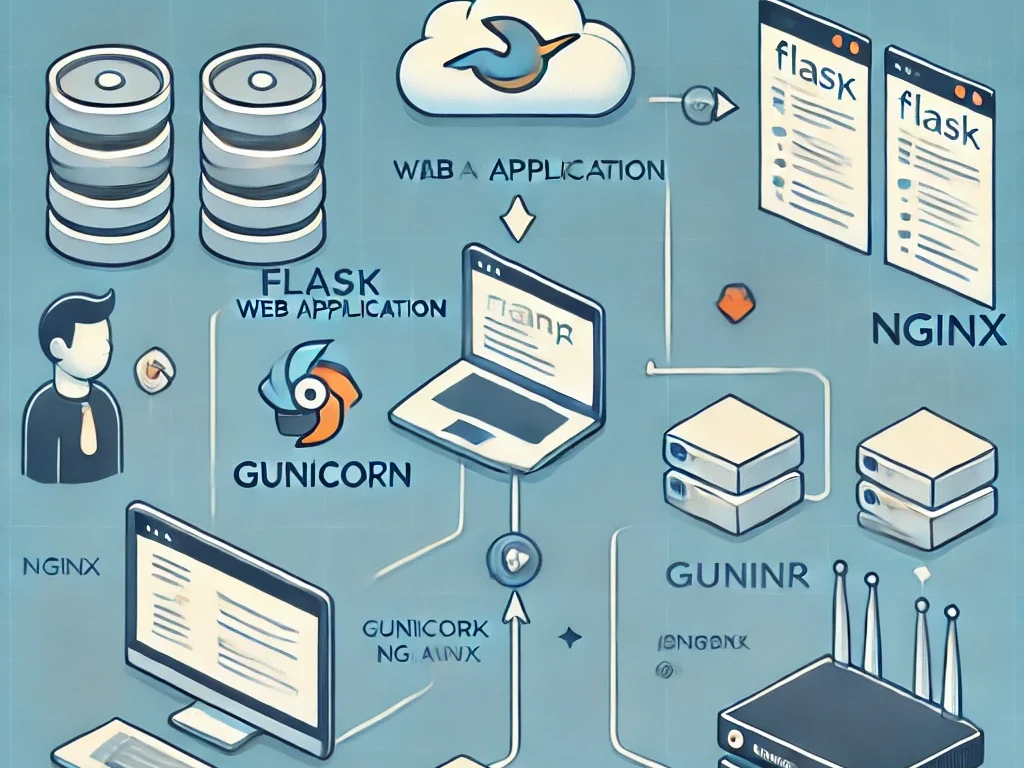
Flask is a lightweight and powerful framework for building web applications, but it is not production-ready on its own. For production deployments, using a WSGI server like Gunicorn is an excellent choice. Gunicorn is reliable, scalable, and works seamlessly with Flask. In this blog post, we’ll walk through setting up Gunicorn to serve your Flask…

Building a Scalable Data Ingestion API with Python
In today’s era of monitoring and predictive analysis, having a flexible and scalable data ingestion system is crucial. In this post, we’ll guide you through creating a simple but powerful Scalable API using Python and Flask that can ingest custom metrics into an InfluxDB instance. This API is designed to accept any metric you define,…

Reviving Backbone Legacy Systems with Modern Automation Tools
Legacy systems are often the backbone of long-standing organizations, housing valuable data and complex workflows that modernize at a snail’s pace. But with today’s automation tools, breathing new life into these systems is easier than ever. In this blog, we’ll explore strategies to enhance and streamline legacy systems using automation, without the need for a…

Extract SNMP and Syslog Data from InfluxDB
After setting up our tools for monitoring in the first series of our Machine Learning Project we have gathers a lot of data. The next step is to query InfluxDB for the relevant SNMP metrics and syslog events. We’ll use Python with the InfluxDB client to connect and extract data into Pandas DataFrames. Set Up…

Transforming Network Data into Predictive Insights with Machine Learning
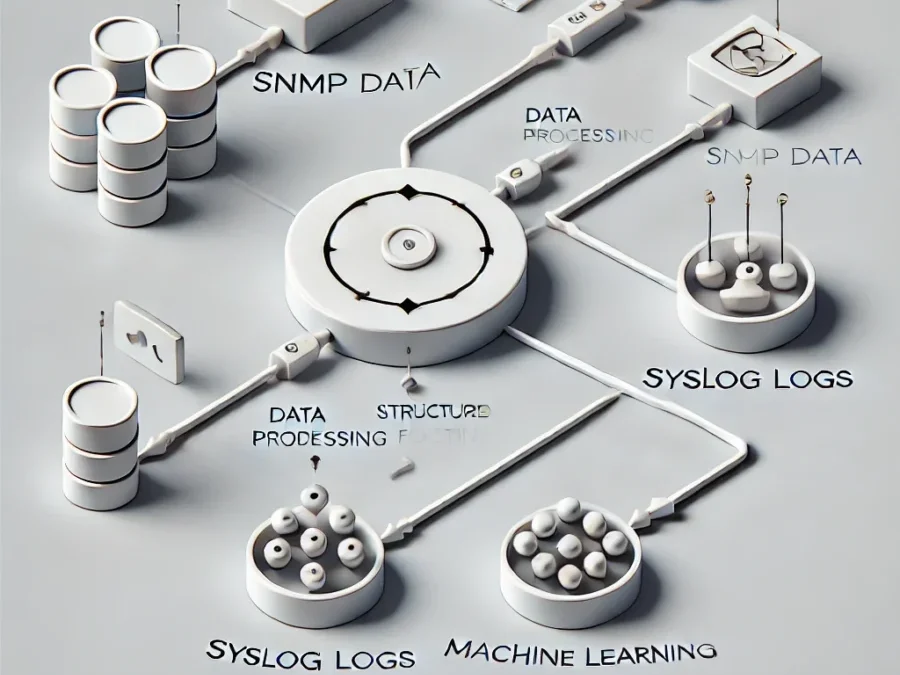
In a world where network uptime and performance are crucial, proactively monitoring network health is only the first step. By tapping into the wealth of data gathered from SNMP (Simple Network Management Protocol) metrics and syslog messages, we can uncover valuable patterns and predict potential issues before they occur. This post explains how we leverage…

Expanding Network Monitoring with Syslog and Zabbix Data
Part 5 of Our Network Monitoring Series Our SNMP-based monitoring system is up and running, collecting vital metrics on CPU, memory, and network activity. In this next step, we’ll enhance our insights by integrating additional data sources: syslog data for a richer view of system logs and events, and the Zabbix API for real-time alert…


